Water quality in Greenland waters can be followed on the Web Published 16.10.2011
In the project “Satellite monitoring of Greenland waters” at Greenland Climate Research Centre, monitoring includes water quality using satellite. Using data from the MERIS instrument on the ENVISAT satellite the chlorophyll-a content in the upper water column can be calculated. This can be used as a measure of algal activity in the ocean surface. Satellite images are useful for providing an overview of the geographical extent of any algae.
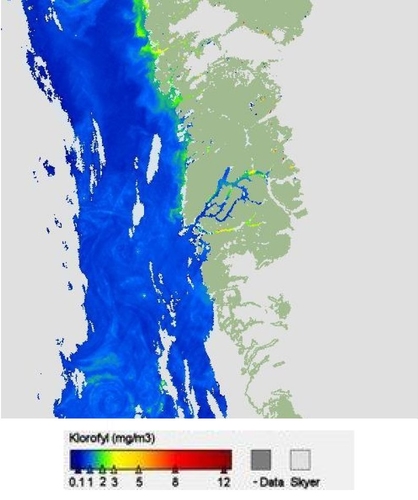
The amount of chlorophyll-a has been determined in connection with each satellite observation during summer at three different places in Greenland. In order for the satellite to take measurements, daylight and a clear sky are required. At Godthåbsfjord, see Figure 1, at Disko Bay, see Figure 2, and Young Sund, see figure 3.
Each month, monthly means of the monthly data for each area are calculated. Figure 4 shows July’s average of Disko Bay.
The website will be expanded to display graphical data of the vertical attenuation coefficient (kd490) and total dissolved material (TSM).
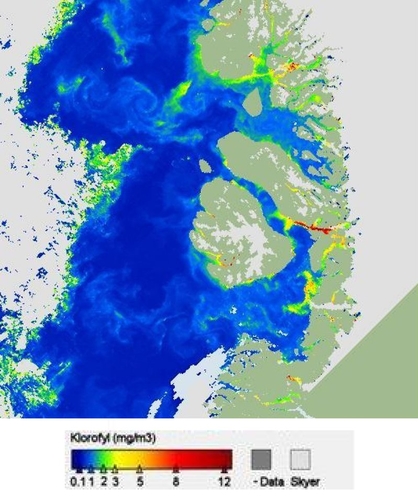
Figure 2 Chlorophyll-a content in the upper water column at Disko Bay on the 2nd July 2011.
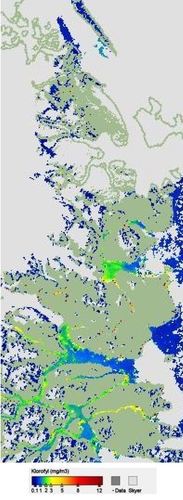
Figure 3 Chlorophyll-a content in the upper water column of Young Sound on 13th July 2011.
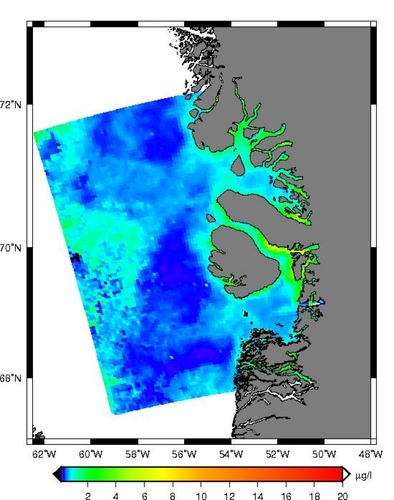
Figure 4 July monthly chlorophyll-a mean of Disko Bay.